Data
OUR FEATURED WORK:
Featured
Use this interactive visualization to compare and contrast countries based on the share of their foreign-born population (International migrant stock).
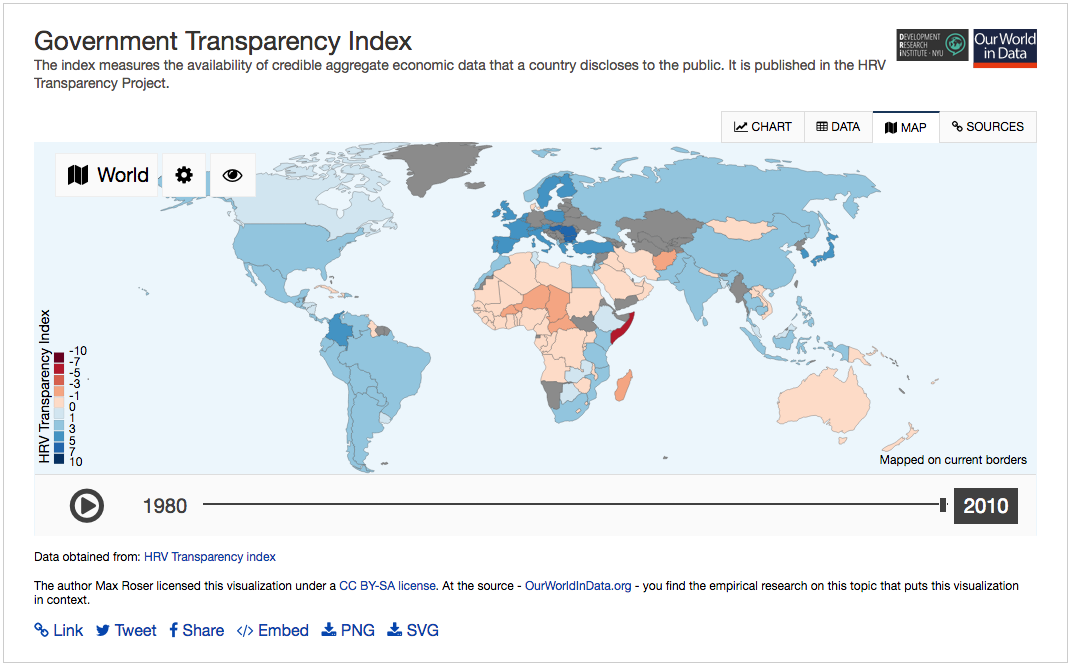
Use this interactive visualization to explore the Government Transparency Index, and navigate how countries score when ranked according to the availability of credible aggregate economic data that is open to the public.
Use this interactive visualization to trace the state of press freedom across the world (1979-2014).
Use this interactive visualization to trace the rate of child mortality across the world (1970-2015).
Use this interactive visualization to trace the share of the population, globally and regionally, with access to improved drinking water (1990-2015).


Use this interactive visualization to compare and contrast the state of economic freedom across the world (1980-2013).