Development Social Science in medical journals: diagnosis is caveat emptor
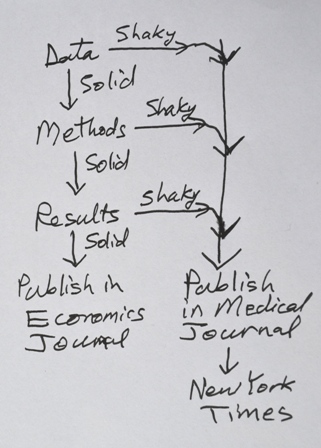
Aid Watch has complained before about shaky social science analysis or shaky numbers published in medical journals, which were then featured in major news stories. We questioned creative data on stillbirths, a study on health aid, and another on maternal mortality.

Just this week, yet another medical journal article got headlines for giving us the number of women raped in the DR Congo (standard headline: a rape a minute). The study applied country-wide a 2007 estimate of the rate of sexual violence in a small sample (of unknown and undiscussed bias). It did this using female  population by province and age-cohort  -- in a country whose last census was in 1984. (Also see Jina Moore on this study.)

We are starting to wonder, why does dubious social science keep showing up in medical journals?

The medical journals may not have as much capacity to catch flaws in social science as in medicine. They may desire to advocate for more action on tragic social problems. The news media understably assume the medical journals ARE vetting the research.

We could go on and on with examples. The British Medical Journal published a study of mortality of age cohorts in five year bands for both men and women from birth to age 95 for 126 countries—an improbably detailed dataset. (The article was searching through all the age groups to see if any group's mortality was related to income inequality.).  Malaria Journal published a study of nationwide decreases in malaria deaths in Rwanda and Ethiopia, except that the study itself admitted that its methods were not reliable to measure nationwide decreases  (a small caveat left out later when Bill and Melinda Gates cited the study as progress of their malaria efforts).

The Lancet published a study that tested an “Intervention with Microfinance for AIDS and Gender Equity (IMAGE)” in order  “to assess a structural intervention that combined a microfinance programme with a gender and HIV training curriculum.” The conclusion: “This study provides encouraging evidence that a combined microfinance and training intervention can have health and social benefits.” This was a low bar for "encouraging:" only 3 out of the 31 statistical tests run in the paper demonstrate any effects -- when 1 out of every 20 independent tests of this kind show an effect by pure chance. (The Lancet was also the culprit in a couple of the links in the first paragraph.) Economics journals are hardly foolproof, but it's hard to imagine research like this getting published in them.

Medical journals would presumably not tolerate shaky medical science in the name of advocacy; why in social science? We also care about rape, and stillbirths, and dying in childbirth. That's why we also care about the quality of social science applied to these tragic problems.

Postscript: we are grateful to Anne Case and Angus Deaton for suggestions and comments on this article, while not attributing to them any of the views expressed here.

Read More & Discuss

Economics professors' favorite economics professors

From a newly published article here. Before anyone on this list gets too much of a swollen head, note that everyone after the top 4 got between 5 and 10 votes out of 299 professors surveyed (there was another group at 4 votes, including a certain J. S*chs). There also seems to be a sheer name recognition effect over-representing economists that show up in the news media, kind of the same way that Donald Trump was leading in the Republican nomination polls recently.

Read More & Discuss

Are Lax US Gun Laws Spilling Violence into Mexico?

The question:

Do more guns cause more violence?

The experiment:

We exploit a natural experiment induced by the 2004 expiration of the U.S. federal assault weapons ban to examine how the subsequent exogenous increase in gun supply affected violence in Mexico. The expiration relaxed the permissiveness of gun sales in border states such as Texas and Arizona, but not California, which retained a pre-existing state-level ban.

The results:

Using data from mortality statistics and criminal prosecutions over 2002-2006, we show that homicides, gun-related homicides and gun-related crimes increased differentially in Mexican municipios located closer to Texas and Arizona ports of entry, relative to those nearer California ports.

Our estimates suggest that the U.S. policy change caused at least 158 additional deaths each year in the post-2004 period. Gun seizures also increase differentially, and solely for the gun category that includes assault weapons. The results are robust to controls for drug trafficking, policing, unauthorized immigration, and economic conditions in U.S. border ports, as well as drug interdiction efforts, trends by income and education, and military and legal enforcement efforts in Mexican municipios.

The conclusion:

Our findings suggest that U.S. gun laws have exerted an unanticipated spillover on gun supply in Mexico, and this increase in gun supply has contributed to rising violence south of the border.

From a paper presented by Oeindrila Dube at NYU’s Development Seminar, with Arindrajit Dube and Omar Garcia-Ponce.


Read More & Discuss

Best and Worst of Official Aid 2011- new release

By Claudia Williamson, Post-Doctoral Fellow, Development Research Institute Rhetoric on “aid effectiveness” keeps escalating, is there anything to show for it?

The past (almost) two years, Bill and I have been collecting data, combing through that data, and refining the numbers to ‘grade’ aid agencies and assess overall trends in aid practices. We waited until our paper passed peer review to release our findings. Rhetoric versus Reality: The Best and Worst of Aid Agency Practices has now been accepted for publication in a special issue of World Development. {{1}}

Our work updated Easterly and Pfutze’s 2008 study, Where Does the Money Go: Best and Worst Practices in Foreign Aid, on five dimensions of agency ‘best practices’: aid transparency, minimal overhead costs, aid specialization, delivery to more effective channels, and selectivity of recipient countries based on poverty and good government.  Based on these measures, we calculate an overall agency score using original data and 2008 OECD data. These scores only reflect the above practices; they are NOT a measure of whether the agency’s aid is effective at achieving good results.

There is slight improvement in transparency and more donors are moving away from ineffective channels. But transparency is still at unacceptably low levels. For example, two agencies (MOFA Japan and France’s DgCiD) fail to report any aid data at all.

The most conspicuous failures in both trends and levels are in specialization and selectivity. Luxembourg is as unspecialized as the US with a 70th of the aid flow. Many such unspecialized small donors likely have most of their aid eaten up by fixed costs before the funds reach any beneficiaries. At the same time, allocation to corrupt countries is increasing, not decreasing. Aid to corrupt autocrats is not explained by emphasis on the least developed countries; donors such as the US, Sweden, and Norway do poorly on both income selectivity and autocracy/corruption selectivity.

The best bilateral agency is UK’s Department for International Development (DFID).

DFID is one of ten agencies that fully reports aid flows to OECD, and it lists number of staff, administrative costs, salaries and benefits and its ODA budget on its website. DFID also has relatively low administrative costs and salaries and benefits relative to aid disbursements (2.6% and 1.6% respectively). DFID relies on more effective channels of aid disbursements, not tying any of its aid and dispersing relatively little food aid (1.3%) (pages 53-54).

Japan, New Zealand, and Germany also do well, rounding out the top five best agencies.  The United States ranks below average mainly because of poor performance on selectivity and choosing to allocate aid through ineffective channels. As we write in the paper, “the foreign policy needs of the US superpower and the lobbies for particular aid channels seem to dominate the politics of American aid” (page 54).

Another theme that emerged is that the Scandinavian countries’ reputation of altruism based on aid volume does NOT translate to good practices; they have below average scores on specialization and transparency and are mediocre in the overall ranking.

Lastly, the UN agencies on average are worse than the other multilateral agencies and the bilateral agencies, and the differences are statistically significant. Above all, they are worse on overhead and transparency. On overhead, they have an average ratio of 46 percent of administrative costs to ODA. UNDP reports no data on its operating costs or ODA, now even worse than its minimal reporting in 2008.

The two goals of the paper were to test if: 1) donors’ rhetoric matches reality; and 2) they are making any improvements in doing so. Our answer is no on both accounts.

Postscript: Fortunately, we are now part of a larger community running independent checks on aid. For other recent aid quality exercises, see Birdsall and Kharas, 2010; Knack, Rogers and Eubank, 2010; and Ghosh and Kharas, 2011.

[[1]]The dataset for the paper can be downloaded here[[1]]

Read More & Discuss

African Universities: Creating True Researchers or “Native Informers” to NGOs?

In a recent speech addressing the Makerere Institute of Social Research in Uganda, Mahmood Mamdani described the state of academic research and higher education in Africa as dominated by a “corrosive culture of consultancy.”

Today, intellectual life in universities has been reduced to bare-bones classroom activity. Extra-curricular seminars and workshops have migrated to hotels. Workshop attendance goes with transport allowances and per diem. All this is part of a larger process, the NGO-ization of the university. Academic papers have turned into corporate-style power point presentations. Academics read less and less. A chorus of buzz words have taken the place of lively debates…

What’s the difference between academic research and consultancy-driven research? Mamdani, who spent decades teaching at universities in South Africa, Tanzania and Uganda before moving to Columbia University, defines research for a consultant as seeking answers to problems posed and defined by a client. But university research, properly understood, requires formulating the problem itself.

His example of how this works in practice is an interesting one. In 2007, the Bill and Melinda Gates Foundation shifted global health spending priorities towards their research question: How to eradicate malaria? But if malaria can’t be eradicated, as a team of scientists from France and Gabon now believe, then researchers have spent four years and hundreds of millions of dollars answering the wrong question.

The cumulative effect of this model is to “devalue original research or intellectual production in Africa.”

The global market tends to relegate Africa to providing raw material (“data”) to outside academics who process it and then re-export their theories back to Africa. Research proposals are increasingly descriptive accounts of data collection and the methods used to collate data, collaboration is reduced to assistance, and there is a general impoverishment of theory and debate.

In my view, the proliferation of “short courses” on methodology that aim to teach students and academic staff quantitative methods necessary to gathering and processing empirical data are ushering a new generation of native informers.

Mamdani, who is now director of the Makerere Institute of Social Research in addition to his professorship at Columbia, seeks to counter the spread of consultancy culture “through an intellectual environment strong enough to sustain a meaningful intellectual culture.”

“To my knowledge,” he said, “there is no model for this on the African continent today. It is something we will have to create.”

HT Africa is a Country.


Read More & Discuss

Controlled experiments and uncontrollable humans

Bill reviewed two much-awaited books for the Wall Street Journal last weekend: Poor Economics by Abhijit Banerjee and Esther Duflo, and More Than Good Intentions by Dean Karlan and Jacob Appel. The Good:

The books' signal achievement is in addressing two disgraceful problems that beset humanitarian aid. The first is that the effectiveness of aid is often not evaluated at all; the second is that even when aid is evaluated, the methods are often dubious, such as before-and-after analysis that doesn't take into account variables that have nothing to do with the aid itself. Humanitarian aid is usually flying blind. These books take the blinders off—de-worming does work, many other efforts do not.

But things are not as simple as they first appear. The authors are brutally honest about how difficult poverty-alleviation is....

...

In addition to testing out ideas, such field work also has the benefit of letting researchers chat informally with poor people—conversation that can be thoroughly illuminating. What looks like irrationality may just be the failure of outsiders to fully appreciate the problem...

....

“More Than Good Intentions” and “Poor Economics” are marked by their deep appreciation of the precariousness that colors the lives of poor people as they tiptoe along the margin of survival. But I would give an edge to Mr. Banerjee and Ms. Duflo in this area—the sheer detail and warm sympathy on display reflects a true appreciation of the challenges their subjects face. Messrs. Karlan and Appel are at their best in addressing the subtleties of behavior and testing them in the psychology laboratory and in the field. They have produced a remarkably readable and credible analysis of the intertwining of irrationality and poverty.

The Not-so-Good:

Unfortunately, the books also indulge another sort of irrationality: the demand for big, general statements even if you’re discussing limited, context-specific matters. The authors criticize over-generalizing and over-promising in the aid business, but they too often do their own exaggerating when it comes to what their methods can deliver. Both books end with overselling, “five key lessons” (Banerjee and Duflo) or “seven ideas that work” (Karlan and Appel), overriding their own previous cautions about sensitivity to context and the limits to each intervention. Other economists criticize overselling as a common fault of those who do these small experiments.

Read the full review (ungated) here.

Read More & Discuss

Money buys happiness after all

Does happiness rise with income? Are people in poor countries less happy than people in rich countries? Much of what we thought we knew on this topic comes from a famous 1974 study by economic historian Richard Easterlin. Easterlin found that within countries, rich people tended to be happier than the poor. But contrary to expectation, rich countries as a whole were not happier than poor countries. And even stranger, in the US, when per capita income rose sharply from 1946 to 1970, bliss did not rise alongside it.

Easterlin resolved this seeming contradiction—known as the Easterlin paradox—by hypothesizing that “[t]he increase in output itself makes for an escalation in human aspirations, and this negates the expected positive impact on welfare.” That is, having more stuff actually tends to make people want more stuff, and doesn’t make them any happier.

The Easterlin paradox has been crumbling, but is not altogether demolished, with new expanded datasets and recent research. A great summary of research collected in a newly published volume International Differences in Well-Being, edited by Ed Diner, Daniel Kahneman, and John Helliwell, plumbs voluminous new data (World Values Survey and Gallup World Polls from a larger set of countries) to update our knowledge.

One important refinement in these new studies is the distinction between feeling happy from day to day (more a mood, perhaps) and long term “life-satisfaction.” The Easterlin paradox does NOT reliably hold with “life-satisfaction.”

Bill lays out exactly which parts of the Easterlin hypothesis appear to be holding up over time, and which are collapsing under the weight of the new data, in a new review published today in the Lancet.

If the Easterlin paradox no longer holds true—particularly the lack of difference between rich and poor countries on average happiness—what are the implications for development policy?

Read More & Discuss

Cash transfers: What are they good for?

There is convincing evidence from a number of countries that cash transfers can reduce inequality and the depth or severity of poverty. For example, in Brazil a combination of cash transfer programmes accounted for 28 percent of the total fall in the Gini index (a summary measure of inequality) between 1995 and 2004…. Well-designed and implemented cash transfers help to strengthen household productivity and capacity for income generation. Small but reliable flows of transfer income have helped poor households to accumulate productive assets; avoid distress sales; obtain access to credit on better terms; and in some cases to diversify into higher risk, higher return activities. These intermediate outcomes help draw poor people into the market economy on terms that allow them to benefit from and contribute to growth.…

There is robust evidence from numerous countries that cash transfers have leveraged sizeable gains in access to health and education services…However, transfers have had less success in improving final outcomes in health or education.  Cash transfers can help the poor overcome demand-side (cost) barriers to schooling or healthcare, but they cannot resolve supply-side problems with service delivery (e.g. teacher performance or the training of public health professionals). Cash transfers therefore need to be complemented by ongoing sectoral strategies to improve service quality.

From a new paper on the evidence for cash transfers from Britain’s aid agency.

I’ve heard people talk about cash transfers as the next silver bullet. They’re frequently mentioned in conversations about what’s “new and innovative” in aid. Studies like this one, that synthesize what we know so far and point out where knowledge is still uneven, can help calibrate those expectations.


Read More & Discuss

How the South was Lost

Vivek Nemana is an economics graduate student in New York University and a student worker at DRI. UPDATE: Art Carden makes an important emphasis regarding this post and contibutes an ungated link to his paper. See comments/bottom of post.

Last week marked 150 years since the beginning of the Civil War. Victory for the North meant more than the preservation of the Union. It meant that slavery could no longer continue as a viable factor of economic productivity. It meant the end of the terrible institution that deemed human beings were property, and heralded an important step in the long American struggle for universal human rights.

But it also reinforced the cleavage between an industrial, prosperous North, and a rural, underdeveloped South, a distinction that persists in some ways even today.’ The Union won in large part because of its industrial advantage, and its victory installed in the South what should have been better conditions for economic growth – liberal, more universal property rights and the abolition of slavery.

So what happened? A 2009 paper by Art Carden{{1}} argues that it was the very insertion of these new freedoms and property rights into a society designed for slavery that led to the divergent development of North and South.

Before the War, Southern social networks were based on hegemonic bonds relying on power imbalances and the threat of violence. The South was heavily invested in racial subjugation – slavery directly accounted for over a quarter of the GDP. The region spent an enormous amount of resources to justify slavery, hiring silver-tongued apologists like John C. Calhoun to spin slavery as humane. In this light, slavery was an economic institution that was designed for racially hegemonic society.

While the Civil War radically restructured Southern laws to promote racial equality and property rights, the hegemonic bonds were resistant to change. This generated a major friction, Carden writes, that manifested through the racist Jim Crow laws and, most gruesomely, lynchings that openly defied the new freedoms for blacks.

The backlash against black self-determination, the politically-enforced segregation, and the conviction that one race was inferior were societal phenomena that hurt economic growth. For example, segregation and racist violence meant that markets were smaller and the division of labor shallower than it could have been. Mutual fear and distrust made contracting and doing business across racial boundaries more expensive. As a result, Carden writes, “Southern entrepreneurs, innovators, and laborers relied more heavily on kinship networks and informal arrangements than on formal markets.”

And these factors were self-reinforcing, Carden argues, breeding a cycle of mistrust, ignorance and poverty.

Gary Becker once wrote that people lose out on the potential gains from trade if one group is able to indulge in “tastes for discrimination” against another. As the legacy of slavery wound its way into postbellum Southern society and politics, it hindered the way freedom and property rights should have boosted the economy, denying the South the full bounty of American development.

[[1]]Here's the ungated version.[[1]]

---------

Photo credit: New York Times and Wikispaces


Read More & Discuss

Evil values are also long-lasting

Academic development economists have become newly interested in cultural values, and one of their most common findings is that cultural differences between regions and towns last a very a long time. I confess I'm a fan of this research. But even I was surprised when a paper at NYU's Development Seminar yesterday showed that if your (regional) ancestors persecuted Jews in 1348-50, you were more likely to become a Nazi in the 1920s and 1930s.

Read More & Discuss

Inception Statistics

We’ve had a lot of very heated debates on this blog about the uses and abuses of global statistics—most recently on estimates of poverty, maternal mortality, and hunger—with a certain senior Aid Watch blogger inciting the ire of many (not least those who produce the figures) by calling them “made-up.”

A new study in the Lancet about the tragic problem of stillbirths raises similar questions: If stillbirths have been erratically and inconsistently measured in the past, especially in poor countries with weak health systems, what then are these new numbers based on?

Of the 193 countries covered in the study, the researchers were able to use actual, reported data for only 33. To produce the estimates for the other 160 countries, and to project the figures backwards to 1995, the researchers created a sophisticated statistical model. {{1}}

What’s wrong with a model? Well, 1) the credibility of the numbers that emerge from these models must depend on the quality of “real” (that is, actual measured or reported) data, as well as how well these data can be extrapolated to the “modeled” setting ( e.g. it would be bad if the real data is primarily from rich countries, and it is “modeled” for the vastly different poor countries – oops, wait, that’s exactly the situation in this and most other “modeling” exercises) and 2) the number of people who actually understand these statistical techniques well enough to judge whether a certain model has produced a good estimate or a bunch of garbage is very, very small.

Without enough usable data on stillbirths, the researchers look for indicators with a close logical and causal relationship with stillbirths. In this case they chose neonatal mortality as the main predictive indicator. Uh oh. The numbers for neonatal mortality are also based on a model (where the main predictor is mortality of children under the age of 5) rather than actual data.

So that makes the stillbirth estimates numbers based on a model…which is in turn…based on a model.

Showing what a not-hot topic this is, most of the articles in the international press that covered the series focused on the startling results of the study, leaving aside the more arcane questions of how the researchers arrived at their estimates. The BBC went with “Report says 7,000 babies stillborn every day worldwide.” Canada’s Globe and Mail called stillbirths an “epidemic” that “claims more lives each year than HIV-AIDS and malaria combined.” Frequently cited statistics included the number of stillbirths worldwide in 2009 (2.6 million), the percentage of those stillbirths that occur in developing countries (98%), the number of yearly stillbirths in Africa (800,000), and the average yearly decline in stillbirth over the period studied (1.1 percent since 1995).

Only one international press article found in a Google search, by AP reporter Maria Cheng, mentioned the possible limitations of the study’s estimates. Not coincidentally, that article interviewed a source named Bill Easterly.

Despite the disinterest of the media, this is a serious problem. Research and policy based on made-up numbers is not an appealing thought. Could the irresponsible lowering of standards on data possibly reflect an advocacy agenda rather than a scientific agenda, or is it just a coincidence that Save the Children is featured among the authors of the new data?

[[1]]From the study: “The final model included log(neonatal mortality rate) (cubic spline), log(low birthweight rate) (cubic spline), log(gross national income purchasing power parity) (cubic spline), region, type of data source, and definition of stillbirth.” [[1]]


Read More & Discuss

Memo to the WHO: Blocking health worker migration is not the answer

This guest post is written by Michael Clemens and Amanda Glassman. Through this Sunday, April 17, the World Health Organization (WHO) is seeking comments on its plans to monitor compliance with a global code of practice on the international migration of doctors and nurses.

We think there are better, cost-effective ways to improve health workforces in developing countries than compliance with this code that is self-contradictory, unlikely to help the poor, and ethically problematic.

First, the code contradicts itself. It establishes that all health workers—like all people—have the right to leave their countries to seek a better life (section 3.4) and that the international movement of health workers between two countries benefits both of them (section 3.8), through skill formation and technology transfer… and then it says that such movement must be stopped. It urges all countries to seek zero international movement of health workers—both by filling all their health sector positions with locals (section 5.4) and by stopping the recruitment of health workers from countries facing shortages (5.1), that is, the poorest countries where conditions for health workers are the worst. This contradiction is as baffling as saying: “You may drive anywhere you wish, now that my friends have taken away your car.”

Second, the self-sufficiency and anti-recruitment strategies endorsed by the code—certain to harm poor-country health workers—are unlikely to improve basic health outcomes for others in the most vulnerable poor countries. Blocking a Mozambican surgeon from stepping across the border into South Africa does little to remedy a long list of problems that primarily determine poor health outcomes in Mozambique: poor sanitation, tainted water supplies, lack of malaria prevention, little incentive for health workers to serve rural areas, a disconnect between health workers’ advanced skills and the basic needs of the poorest, risky sexual practices among the public, absenteeism at ostensibly staffed clinics, constraints on income and education that limit the public’s demand for formal health care, lack of pharmaceuticals, needless legal barriers to private practice for underserved communities, and so on.

Finally, while the benefits of forcibly blocking that Mozambican doctor from entering South Africa are unclear, the harm is perfectly clear. It certainly limits her freedom in a way that no one at the WHO would want their own freedoms restricted. Whether her movement is blocked by denying her entry at the border, by eliminating all the jobs she could have taken (self-sufficiency for South Africa), or by concealing from her any information about those jobs (banning anyone from recruiting her), the effect is equally ethically troubling. Her movement is stopped by others, against her will, without consulting her. Worse, it is usually done by people enjoying vastly higher living standards than she can enjoy in Mozambique, living standards that most of them enjoy by birthright.

Fortunately, there are good alternatives to coercive barriers on health worker movement. A team of World Bank health experts recently studied the human resource policies of Kenya, Zambia, Rwanda, and the Dominican Republic, and found several other ways that all four countries could improve the effectiveness of their health workforces:

[S]ignificant weaknesses were found in policies and practices related to recruitment, deployment, transfer, promotion, sanctioning, and payment methods of public sector health workers. Recruitment processes are plagued by delays and not targeted to areas with staff shortages. Salaries and allowances are not being used to provide strong incentives for increasing rural practice and lowering absenteeism. Available wage bill resources are often not fully spent, and even when they are, considerable scope is available to use these resources more strategically. Thus, improving recruitment, deployment, transfer, promotion, and remuneration practices is just as important—and maybe more important—than expanding the health wage bill in addressing health workforce challenges.

In other words, there is much that countries can do to make their health workforces more effective—with the side effect of decreasing health workers’ incentive to emigrate—even without spending much more money.

Likewise, Dr. Churnrurtai Kanchanachitra and co-authors have just offered a long list of ways that developing countries can strengthen health workforces without coercing health workers’ movement. These include creating incentives for health workers to work in rural areas; dealing with other constraints like financial barriers and poor-quality health services that might be even more important in affecting health outcomes; and creating partnerships between hospitals from sending and receiving countries.

The WHO has chosen instead to focus on blunt instruments of coercion in its code of practice. But governments are not bound to the code, and may make better choices. As the WHO considers its guidelines for monitoring compliance with that code, it should reconsider the sections relating to self-sufficiency and anti-recruitment and strike them from the final version. We urge governments and the WHO to work constructively with the many alternative tools available to improve developing-country health outcomes and health systems without the troubling methods of coercion.

Read More & Discuss

Finally, the definitive guide to creatively manufacturing your own research result

From the brilliant xkcd (also the creator of this classic in statistics humor).

We couldn’t resist using this as a way to illustrate some of our early wonky posts complaining about the suspected practice of “data mining” in aid research.

In aid world, research looks for an association of some type between two factors, like economic growth and foreign aid. But since both growth and aid contain some random variation, there is always the possibility that an association appears by pure chance.

“p < .05” is our assurance from the researchers that the probability that their result came about by coincidence is less than 1 in 20, or 5 percent, which is the accepted standard.

But the aid researchers—like the jelly bean scientists—are eager to find a result, so they may run many different tests. The problem, as Bill explained it, is that:

The 1 in 20 safeguard only applies if you only did ONE regression. What if you did 20 regressions? Even if there is no relationship between growth and aid whatsoever, on average you will get one “significant result” out of 20 by design. Suppose you only report the one significant result and don’t mention the other 19 unsuccessful attempts.…In aid research, the aid variable has been tried, among other ways, as aid per capita, logarithm of aid per capita, aid/GDP, logarithm of aid/GDP, aid/GDP squared, [log(aid/GDP) - aid loan repayments], aid/GDP*[average of indexes of budget deficit/GDP, inflation, and free trade], aid/GDP squared *[average of indexes of budget deficit/GDP, inflation, and free trade], aid/GDP*[ quality of institutions], etc. Time periods have varied from averages over 24 years to 12 years to to 8 years to 4 years. The list of possible control variables is endless….So it’s not so hard to run many different aid and growth regressions and report only the one that is “significant.”

And the next thing you know, there’s a worldwide boycott of green jelly beans…

UPDATE by Bill 12 noon: I asked around some journalist contacts of Aid Watch at leading newspapers how much awareness of this problem there is in the media, and got a fairly clear answer of ZERO.

Read More & Discuss

Stories our data tells us: 3 Ways of Looking at a Dictator

Next installment in our popular (for wonks maybe?) series on the volatility of growth outcomes under autocracy: What if we have it backward, and growth volatility causes autocracy?

The picture below shows the association between per capita growth outcomes and a measure of "individualist" values.

Once again the most striking thing is the high variance of growth outcomes under collectivist values, and a much lower variance under individualist values. Which causes which? One plausible story is that collectivist values evolve in highly volatile environments in which people long for collective insurance mechanisms -- like the family/clan/nation coercing the most successful members of the family/clan/nation to sacrifice their rewards for everyone else. In safer environments (those on the right in the graph), it's easier for individuals to assert their rights and responsibility to fend for themselves and keep the rewards of their own efforts.

Of course, individualism is also highly correlated with actually having democracy, while collectivist values predict autocracy.

We have now had in our series 3 different stories for why autocracies have higher variance of growth outcomes:

  1. Growth volatility under autocracy is all about the benevolence of Lee Kuan Yew versus the malevolence of Mobutu.
  2. It has nothing to do with autocrats, it is just there's more measurement error in low income economies (which are typically also autocracies).
  3. OK maybe it is autocracy, but high volatility causes autocracy, not the other way around (TODAY'S POST).

The present author seems to have evolved beyond the dreaded two-handed economist to being a three-handed economist. Actually, there are other tests we could do to discriminate between stories or to apportion how much each accounts for the outcome.

But I have a different point -- we are often tempted to stop too soon, to tell just ONE story that could --horrors! -- depend partly on our self-interest and preferences.

Story #1 has been the default most-popular-girl-in-the-class so far. It's convenient for the autocrats(!), and for those who aspire to advise them and give them aid.

Stories #2 and #3 are more about the limits of expert knowledge and influence, which sounds like yet another way to be unpopular.

Technical Notes:

“Individualism” is obviously a slippery concept both in theory and in measurement. This exercise (from work in progress by this author) tried to get a rough measure by averaging over 3 independent measures: (1) the World Values Survey asks each respondent (Question E037) to identify themselves on a 1 to 10 scale from People Should Take More Responsibility (1) to Government Should Take More Responsibility (10). (2) Hofstede (1980,2001 ) surveyed IBM employees in a sample of countries around the world and used factor analysis on the answers to construct a spectrum from “collectivist” to “individualist” values. (3) Schwartz (1994, 1999) used answers on a survey of values from 15,000 schoolteachers around the world to construct a measure going from “person as embedded in the group” to “person viewed as autonomous…who finds meaning in his or her own uniqueness.” Each measure was normalized to have mean zero and standard deviation 1 where positive values are in the direction of more individualism, and then a summary measure used an average over any or all of the 3 measures available for each country.

References

 Hofstede, Geert H., 1980. Culture’s Consequences: International Differences in Work-Related Values. Sage, Thousand Oaks, CA.

Hofstede, Geert H., 2001. Culture’s Consequences: Comparing Values, Behaviors, Institutions, and Organizations Across Nations, second ed. Sage, Thousand Oaks, CA.

Schwartz, Shalom H., 1999. Cultural value differences: Some implications for work. Applied Psychology International Review 48, 23–47.

Schwartz, Shalom H., 1994. Beyond individualism/collectivism: new cultural dimensions of values. In: Uichol, Kim, Triandis, Harry C., Kagitcibasi, Cigdem, Choi, Sang-Chin, Yoon, Gene (Eds.), Individualism and Collectivism: Theory, Method, and Applications. Sage, Thousand Oaks, CA.

Read More & Discuss

Are celebrities good for development aid?

by Lisa Ann Richey and Stefano Ponte Recent New York Times coverage of Madonna’s “Raising Malawi” school project has once again drawn attention to the role celebrities play in raising awareness and funds for international aid. But at the same time, the report—which chronicled the collapse of Madonna’s poorly-managed venture—brings negative exposure to “good causes” for Africa.

There was a similar case in January, when an Associated Press story on corruption in The Global Fund to Fight AIDS, Tuberculosis and Malaria was picked up by 250 media outlets worldwide with headlines such as “Fraud plagues global health fund backed by Bono.” Would the media spread with such great interest a story of lavish spending in any run-of-the-mill private school in Malawi or of corruption in the United Nations? Probably not.

The Global Fund is now known as “celebrity backed,” and almost no news story of the recent corruption saga has been without reference to Irish rock star Bono and celebrity philanthropist Bill Gates. Celebrities draw attention and stir emotion. But now, the opportunity to link development aid mismanagement or lavish spending with global celebrities has led to negative publicity.  People all over the world are interested in what is happening to “Bono's Fund” or “Madonna’s Malawi.” Yet, as is often the case with celebrity-driven media, the stories actually provide little information on what is going on in The Global Fund or in the countries where it works, or in the education sector in Malawi.

We explore this phenomenon in Brand Aid: Shopping Well to Save the World (just released by the University of Minnesota Press).  In the book, we examine what happens when aid celebrities unite with branded products and a cause. The resulting combination—what we call “Brand Aid”—is aid to brands because it helps sell products and builds the ethical profile of a brand. It is also a re-branding of aid as efficient and innovative, based on “commerce, not philanthropy.”

In the case study of Product (RED), a co-branding initiative launched in 2006 by Bono, we show how celebrities are trusted to guarantee that products are “good.” Iconic brands such as Apple, Emporio Armani, Starbucks and Hallmark donate a proportion of profits from the sale of RED products to The Global Fund to finance HIV/AIDS treatment in Africa. In essence, aid celebrities are asking consumers to “do good” by buying iconic brands to help “distant others” —Africans affected by AIDS. This is very different from “helping Africa” by buying products actually made by Africans, in Africa, or by choosing products that claim to have been made under better social, labour and environmental conditions of production.

In Product (RED), celebrities are moving attention away from “conscious consumption” (based on product information) and towards “compassionate consumption” (based on emotional appeal). To us, this is even more problematic than the risk of negative media attention that celebrities bring to development aid.

--

Lisa Ann Richey is professor of development studies at Roskilde University. Stefano Ponte is senior researcher at the Danish Institute for International Studies. To read more, see their book Brand Aid: Shopping Well to Save the World (University of Minnesota Press, 2011). Join the conversation on Facebook or on Twitter: @BrandAid_World


Read More & Discuss

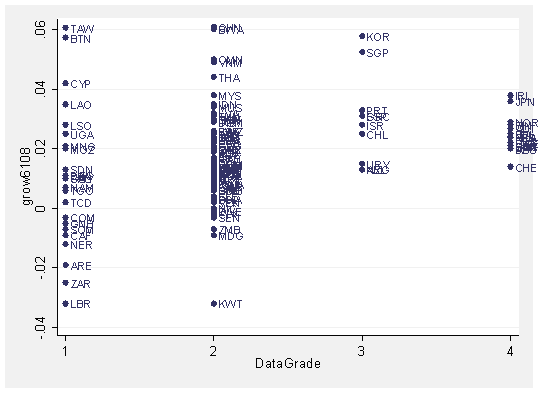
Does growth reflect good and bad dictators, or just good and bad statisticians?

As a previous post showed, autocracies have high variance of growth outcomes (also illustrated in the graph above). The usual interpretation is that benevolent autocrats cause good outcomes while malevolent autocrats cause bad growth outcomes.  Democracy has checks and balances that prevents malevolent people from having too much power to generate bad outcomes, but also restrains the good ones from doing what they want to achieve the great outcomes.

Unless this is completely wrong. Autocracy is only one dimension of society, after all, and is heavily correlated with other dimensions that could cause high dispersion of development outcomes, such as dependence on commodity exports, dependence on agriculture, civil wars, and ... BAD STATISTICIANS (?!)

Bad statisticians make a lot of measurement mistakes. Average growth over 1960-2008 might have zero mistake ON AVERAGE, but there will randomly be some countries with a string of exaggerated growth rates. Other countries will randomly have a string of underestimated growth rates. So the variance of growth will be higher the worse the data quality -- which is exactly what we see in the picture.

Of course, I am not saying China or Singapore or Taiwan have high growth (and Liberia has horrible growth) ONLY because of measurement error. Other indicators confirm the East Asian booms -- but are we really sure growth was 6 percent per capita per year, instead of 4 percent per capita per year?

How bad is bad quality data? Alwyn Young at LSE has a fascinating recent paper in which he points out:

although the on-line United Nations National Accounts database provides GDP data in ...constant prices for 47 sub-Saharan countries for each year from 1991 to 2004, the UN statistical office which publishes these figures had, as of mid-2006, actually only received data for just under half of these 1410 observations and had, in fact, received no constant price data, whatsoever, on any year for 15 of the countries for which the complete 1991-2004 on-line time series are published.

So for 15 African countries, "bad quality data on real GDP growth" really means "NO data on real GDP growth".

Next time you are praising an autocrat for a glorious growth record, remember you may really just be praising an incompetent statistician.

Read More & Discuss

The World Economy goes East: should the West get hysterical?

Danny Quah of LSE has a new article "The Global Economy's Shifting Centre of Gravity". Here's the shift, where black dots denote the easterly shift that has already happened 1980-2007, and red dots the projected shift 2010-2049:

[CORRECTION: I got the following paragraph wrong {the original in brackets}: {The future shift extrapolates current trends. This is iffy given how individual country growth is mean-reverting, but I will leave that for another day.} Danny Quah has clarified to me that he does take mean reversion into account, so I apologize to him for misreading his description of his technique, and there is nothing "iffy" about it.]

If the Economy indeed continued East this way, is this really bad for the West? Professor Quah does not address this in the article, but of course the question begs asking.

The answer is: Of course not. Economic growth is not an elimination tournament like the current NCAA basketball madness, where one team wins and the other goes home. When a previously poor part of the world gets richer, everybody wins.

Temporarily and illegimately assuming the role of official spokesman for the West, here's our view: the richer are our trading partners, other things equal, the more demand for our products, the more and better jobs created thereby, the more gains from trade, the more innovation as the extent of the world market grows, and the more we can benefit from the additional human capital and innovation happening in the East.

And then temporarily and illegimately becoming development spokesman: higher growth in the poorer East means catching up to the richer West. Isn't that what we always wanted?

In sum, what's not to like?

Read More & Discuss

Solving the education puzzle? Test scores and growth

There has long been a mystery in why the rapid growth of education in poor countries did not pay off in growth of production per worker, above all in Africa (best captured by a classic paper by Lant Pritchett, Where has all the education gone?, ungated here) Eric Hanushek at Stanford has been working for the past several years on test scores as a possible resolution of the puzzle. If education doesn't translate into higher test scores, then there is something else wrong along the way, which likely includes well-known problems like absent teachers and missing textbooks. He showed this picture in a 2008 paper, and he has a stream of papers since, all with coauthor Ludger Woessman.

Growth is growth of income per person 1960-2000. Both growth and test scores are measured "conditionally," that is how well they do relative to a country's initial educational enrollment and income in 1960.

Of course, test scores are a potentially sensitive subject, as some will think they are tests of intrinsic intelligence. Is this whole area of research racist?

Not necessarily, of course. Let's take racist stories of differing intelligence between nations off the table, and consider all the other factors that could be reflected in such widely varying test scores relative to educational enrollment and income.

Read More & Discuss

Hey, fellow committee member, are you the weakest link?

UPDATE: 12:18 PM SEE END OF POST I was just on a committee that selected a small number of papers from a large number of submissions for a conference.  We each graded each paper and then we had to come up with a rule to go from our individual grades to a ranking of the papers to decide which ones got into the conference. So here are some possible rules:

(1) one veto kills the paper

So the overall grade for the paper equals the minimum of all of our grades, so if even just one of us flunks the paper, the paper flunks. You need to satisfy all of us. In econ lingo, you can't SUBSTITUTE one of us with a positive opinion for another one of us with a negative opinion.

ANALOGY: the "weakest link" production function, in which whatever input the economy has least constrains the whole output. Note that zero substitution means that all inputs/committee members are perfect complements. This is the world view of those who like Big Pushes to increase all the development  inputs at once.

(2) simple average

Averaging our grades goes to the other extreme of perfect SUBSTITUTION between us. One of us with a positive opinion cancels out (i.e. substitutes for) another one of us with a negative opinion. We committee members are not complements at all: the value of my grade is not influenced by your grade.

ANALOGY: the old Human Development Index.

Also in production functions relating Development to inputs, this rule  implies extreme flexibility. Rich economies feature this selectively to compensate for weakest links -- if the whole system is going to fail because of one input, then have a backup input that is a perfect substitute.

(3) geometric averages

This exotic animal  (cube root of the 3 grades multiplied together) is in between (1) and (2). You can partially but not completely substitute for one of us with another one of us. So for example if we were just grading A,B,C (numerically 3,2,1), then a paper with the score (2,2,2) has a higher geometric average than a paper with the grades (3,1,2) although they both had the same simple average under 2. We are also partial complements -- the higher is your grade, the stronger is the effect of my grade.

ANALOGY: the new Human Development Index, which an Aid Watch post criticized for TOO MUCH complementarity. The higher was committee member Per Capita Income, the stronger was the effect of another committee member Life Expectancy, which has the unappealing property that we value lives of rich people far more than those of poor people. Makes more sense for production functions than for HDI.

The ending of the actual committee story-- qualitative discussions were necessary for choosing the final papers in the end after constructing the mechanical indexes. Let me see what is the analogy here...

UPDATE: thanks to both of you for reading this wonky post all the way to the end. Do you think I have atoned for that Swimsuit Edition post now? and even the followup Swimsuit Edition post also?

Read More & Discuss

Where the money goes, Egypt edition

UPDATE 12:24 PM: US Aid here refers to Official Development Assistance, not military aid. See US military vs economic assistance  and US aid by sector in Egypt here.

This chart comes to us from the people at AidData, a data portal that provides detailed information down to the individual project level for aid funds spent by traditional and non-traditional donors.

The categories used are from research by Simone Dietrich, who explained: "Public sector captures US aid flows to Egypt that directly involve the Egyptian government in the implementation, ranging between budget support and technical assistance. Bypass aid, on the other hand, captures aid that flows 'around' the Egyptian government and is implemented by multilateral organizations, NGOs, or private contractors. "

So, has US aid been better at supporting the Egyptian government, or the Egyptian people?

Read More & Discuss