Cool maps: Measuring growth from outer space
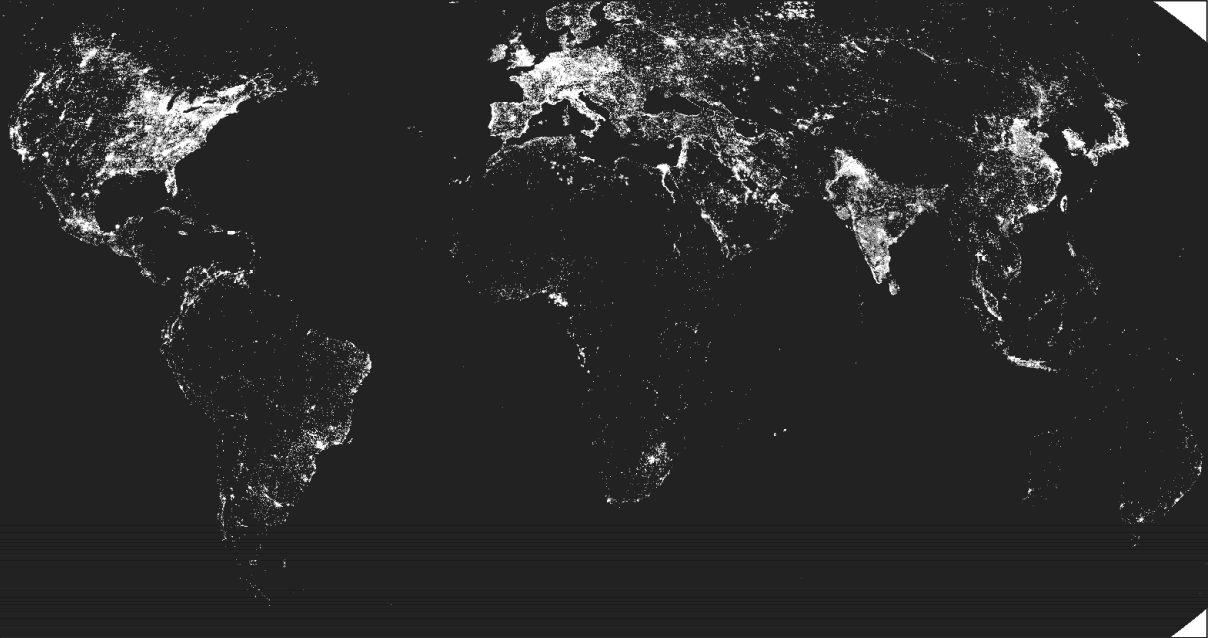
For many of the world's poorest countries, figures measuring economic growth are unreliable, and in some cases they don't exist at all. In an NBER working paper, Brown University professors J. Vernon Henderson, Adam Storeygard, and David N. Weil came up with an interesting proxy for GDP growth: the amount of light that can be seen from outer space.

Of course, the light intensities pictured in this world map reflect both income and population density. The authors explain:
In the United States, where living standards are fairly uniform nationally, the higher concentration of lights in coastal areas and around the Great Lakes reflects the higher population densities there. The comparison of lights in Western Europe and India reflects huge differences in per capita income, as does the comparison between Brazil and the Democratic Republic of Congo.
While GDP figures are almost always reported at the national level, the night lights allow us to see the growth of cities and regions too. The lights may be better able to show activity in the informal economy, and can be captured far more frequently, and with less of a time lag, than GDP figures.
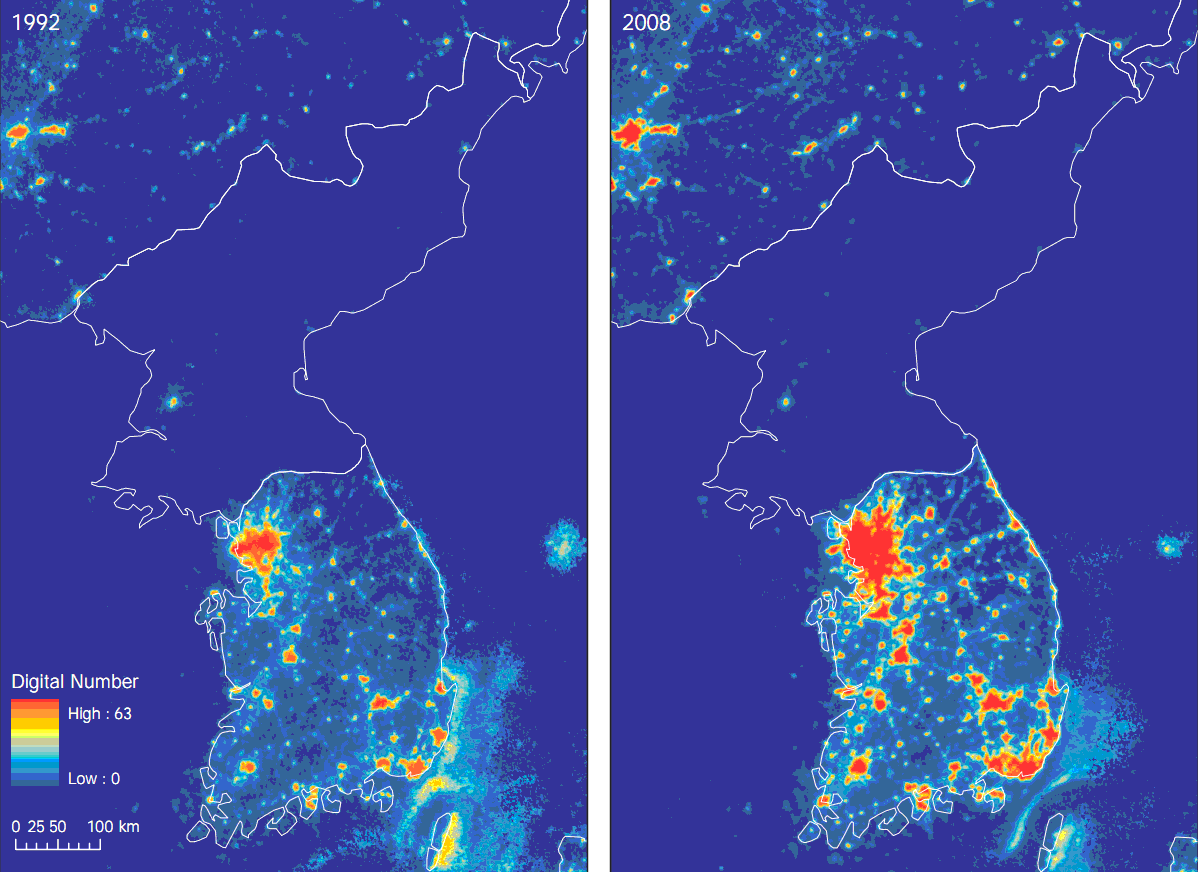
Growth in light intensity not only "gives a very useful proxy for GDP growth over the long term;" the authors also found that it "tracks short term fluctuations in growth." One example shows the dramatic contrast in long term growth between North and South Korea, and gives a picture of how quickly South Korea has developed over the last two decades:
Another example illustrates how genocide literally darkened Rwanda in 1994:
 From Aid to Equality


